
New Lower High Or Continuation?
- Nov 9, 2025
- 1 min read
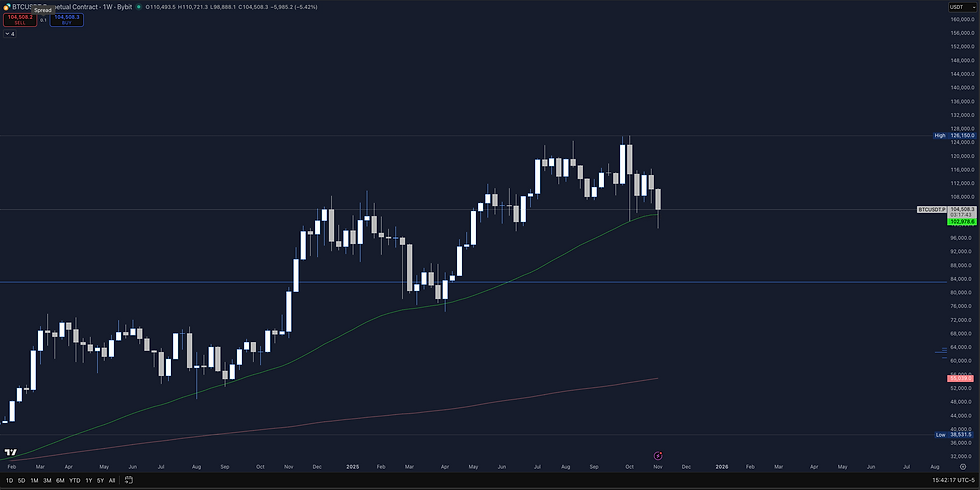
After last week's widespread selling pressure, Bitcoin dropped to new lows in the upper 98k range, breaking below a long-term consolidation support at 108k.
As the weekly session nears its close, buyers are actively defending important levels such as the 50 Weekly Moving Average currently trading above the 102979k.
Focusing on the 4-hour time frame, Bitcoin has formed an M shape that aligns with a Bullish Butterfly pattern in the harmonic structure bouncing into the Value Area Low of 105k this Sunday afternoon before the futures market opens.

Considering the downtrend channel, it is likely that Bitcoin might retest the channel's upper boundary as the supply zone, leading into a new week with significant economic events expected, such as the CPI report.
In this scenario, I'm anticipating the development of a W pattern. On the hourly time frame, a bearish deep crab pattern is emerging, which corresponds with the upper boundary of the channel as a potential lower high where previous structure support in the 107k - 108k region could manifest as a new structure resistance where the next lower risk opportunity may present itself.

As additional data emerges, we will monitor new datasets to present the findings from an unbiased perspective.


Comments